
Nattest Geo
StructPulse
Structural and geotechnical monitoring for buildings, slopes, bridges, tunnels, rail, drainage, rockfall, pipelines and dams. Every sensor, its trend and its limits on one screen.
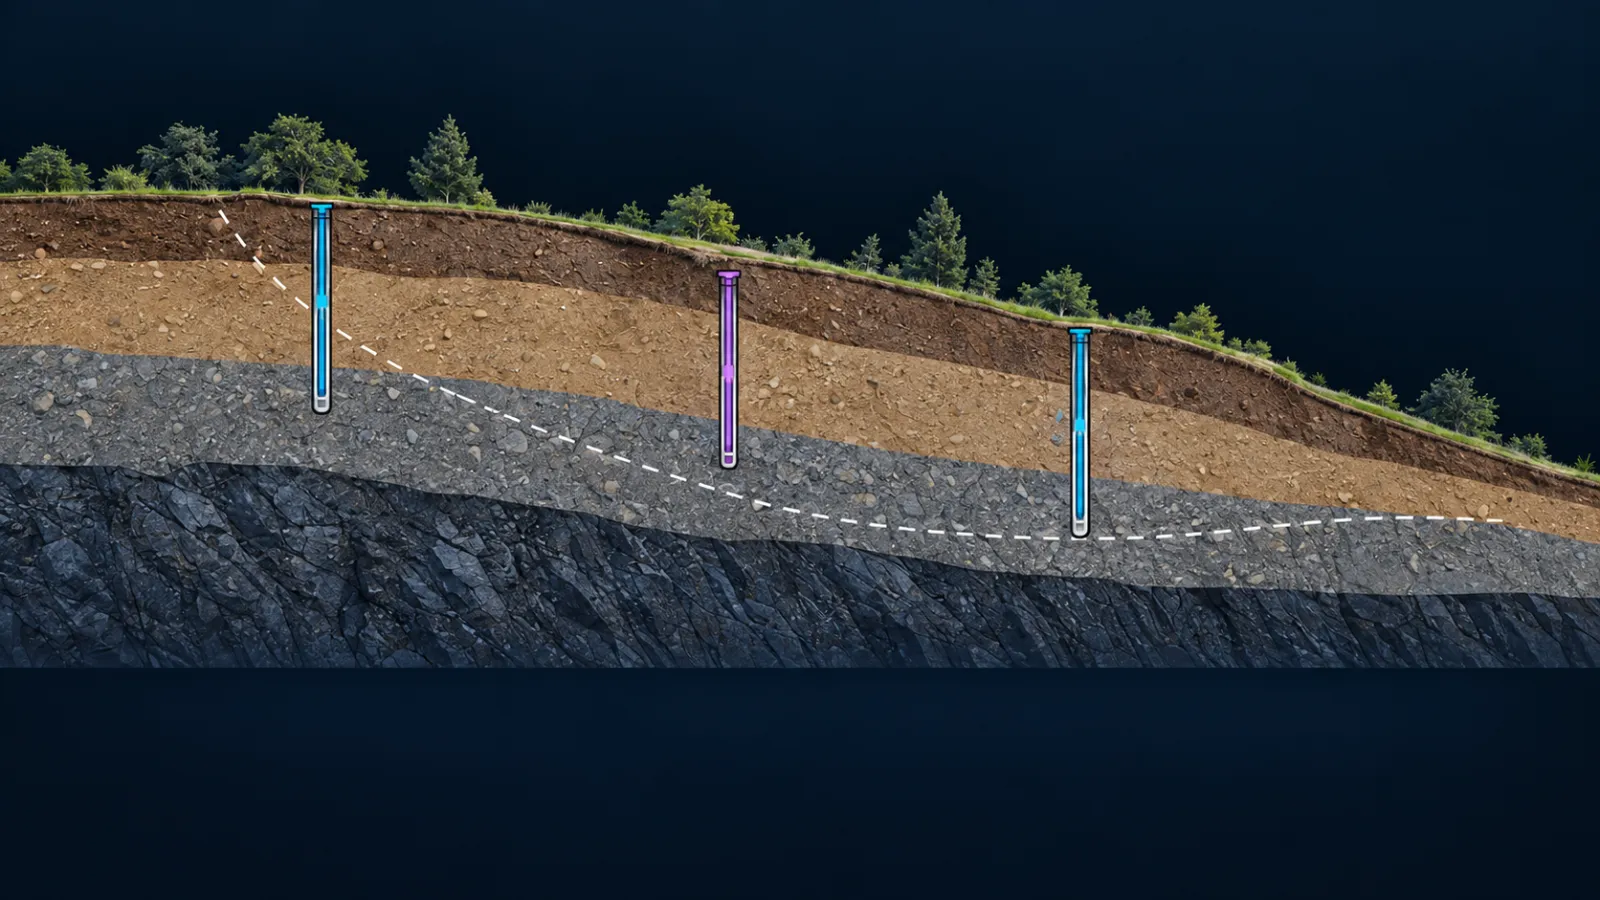
Reading Mean ±1σ Alert limit
Readings on this page are simulated. Choose an asset type or a sensor to follow its trend.
How it works
From the instrument on site to the decision in the office.
- 1
Sensors
Installed by Nattest Geo on the structure and in the ground.
- 2
Gateway
Readings collected on site and sent on schedule.
- 3
StructPulse
Every reading checked against its Watch and Alert limits.
- 4
Alerts and reports
Events for the team, reports for the engineer.
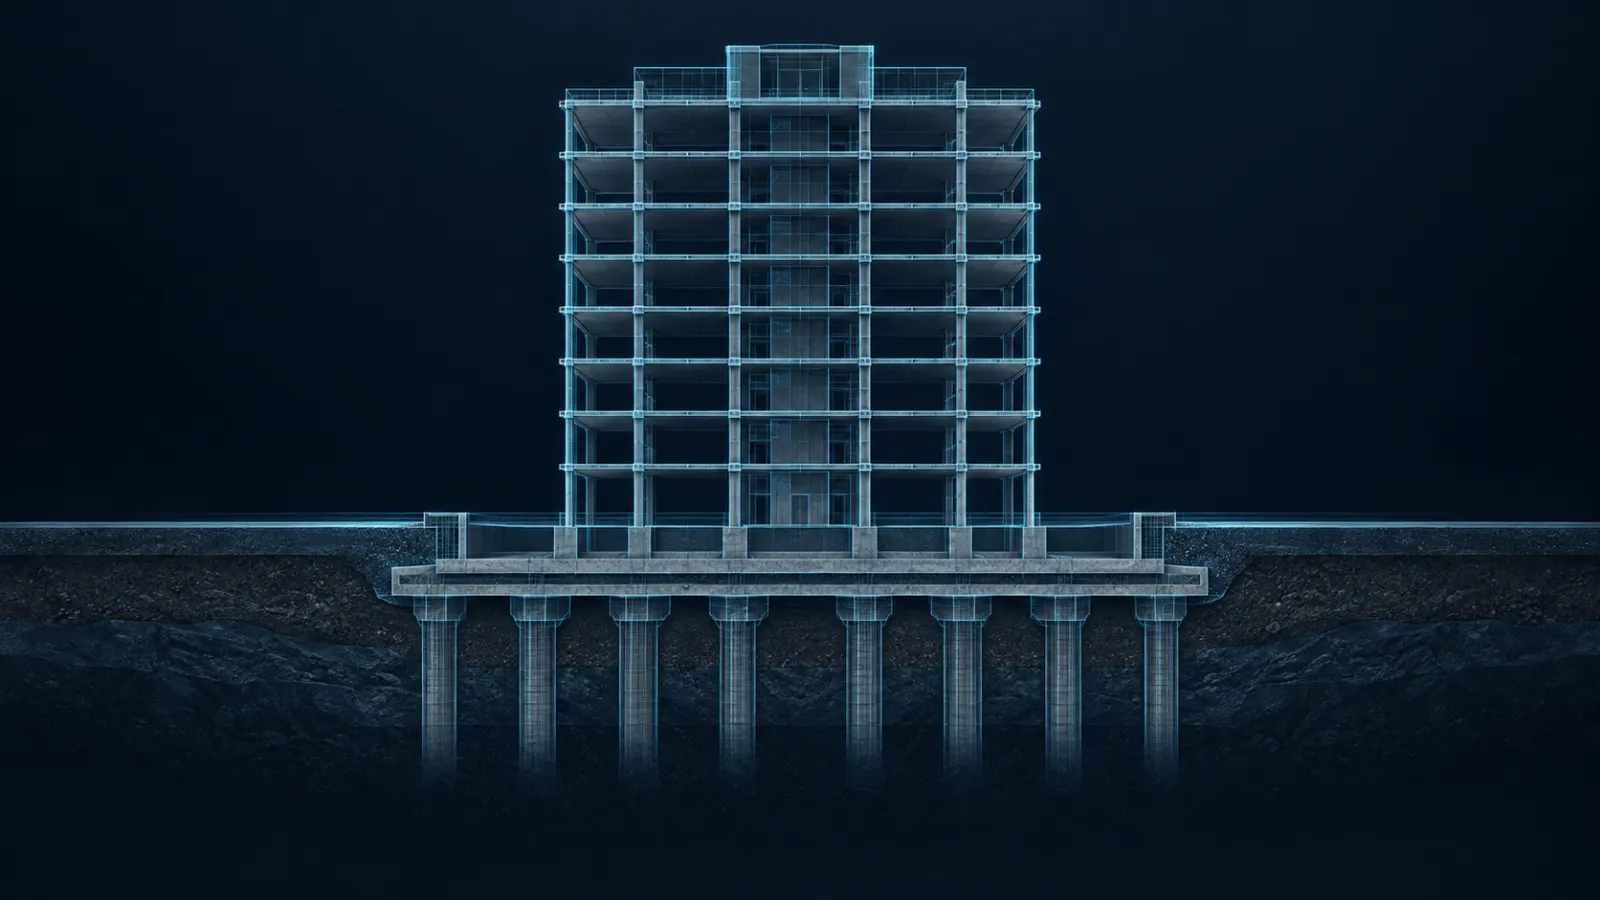
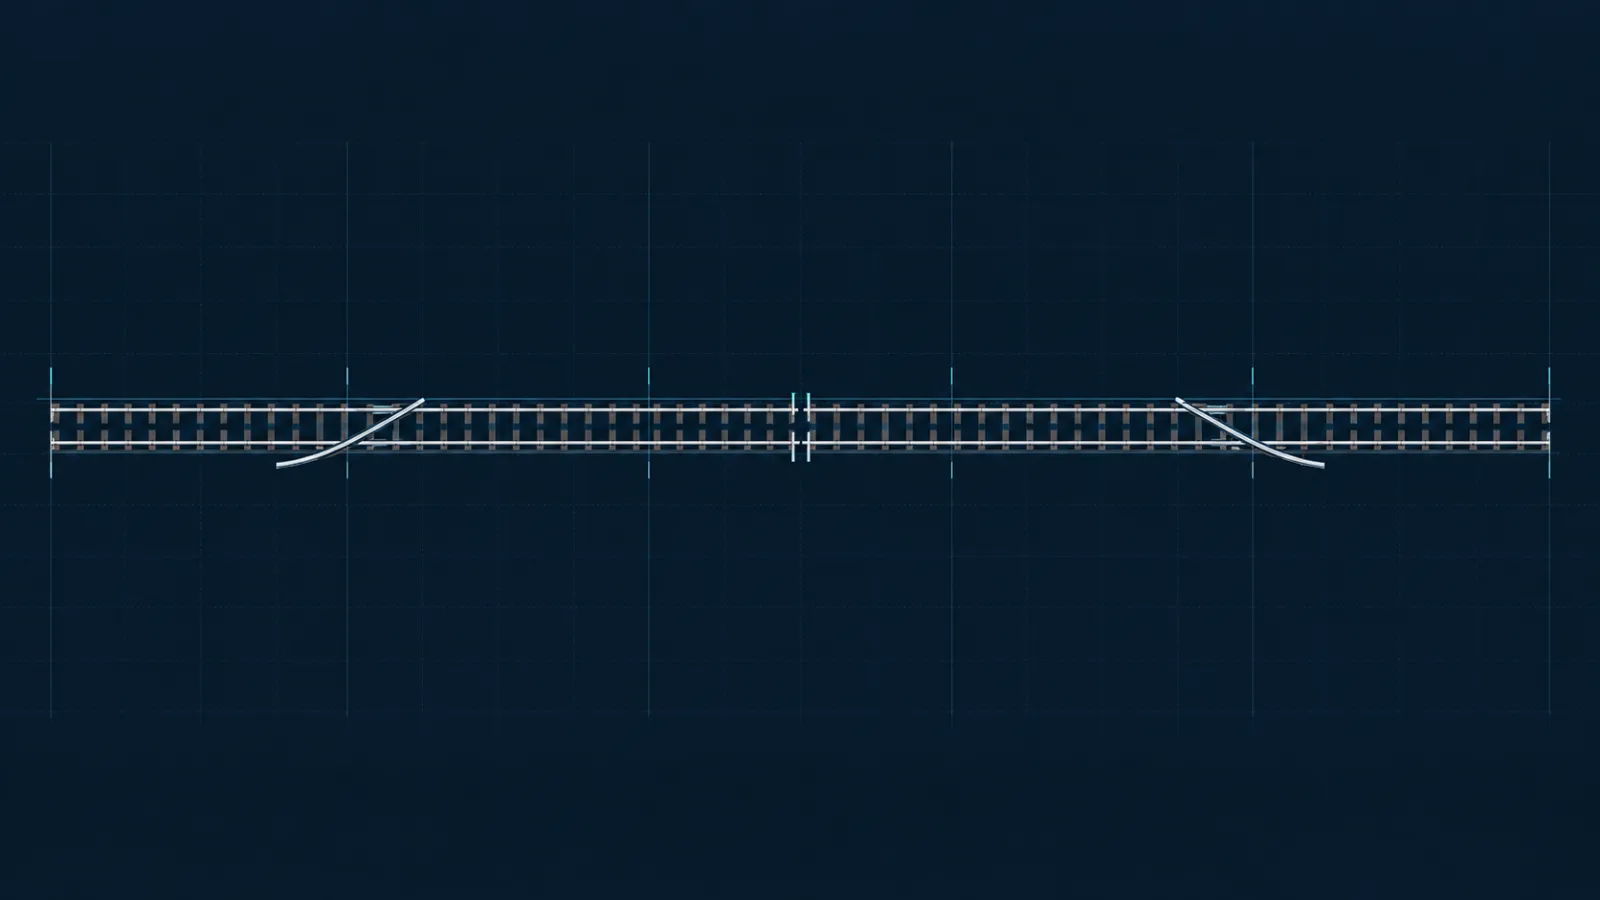
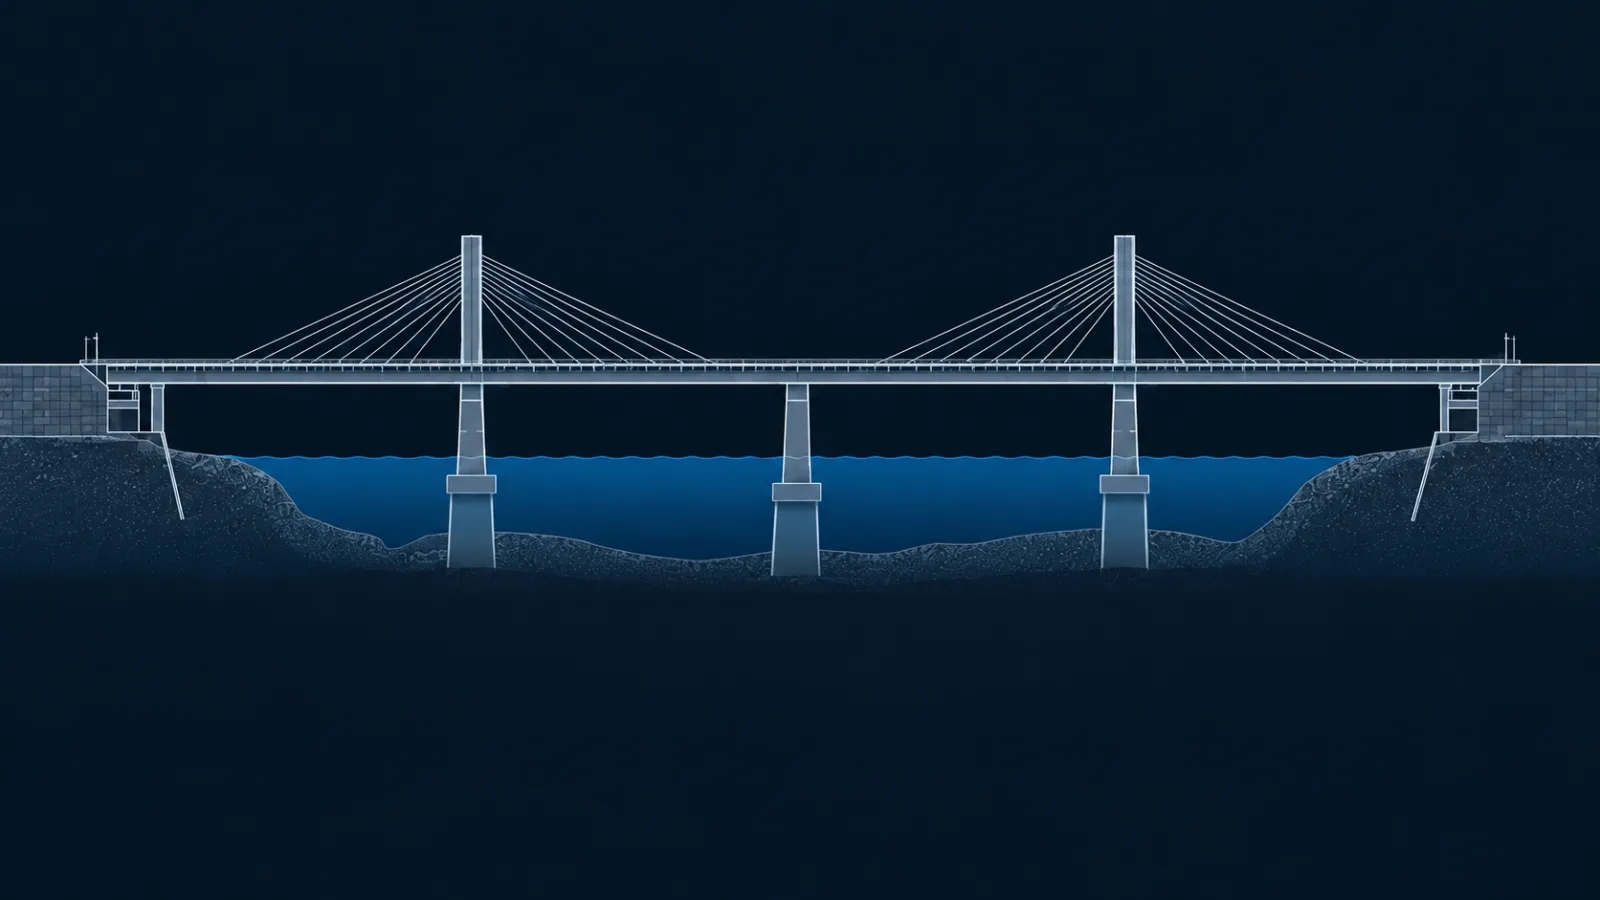
Nine asset types
Each with its own diagram, instruments and key readings.
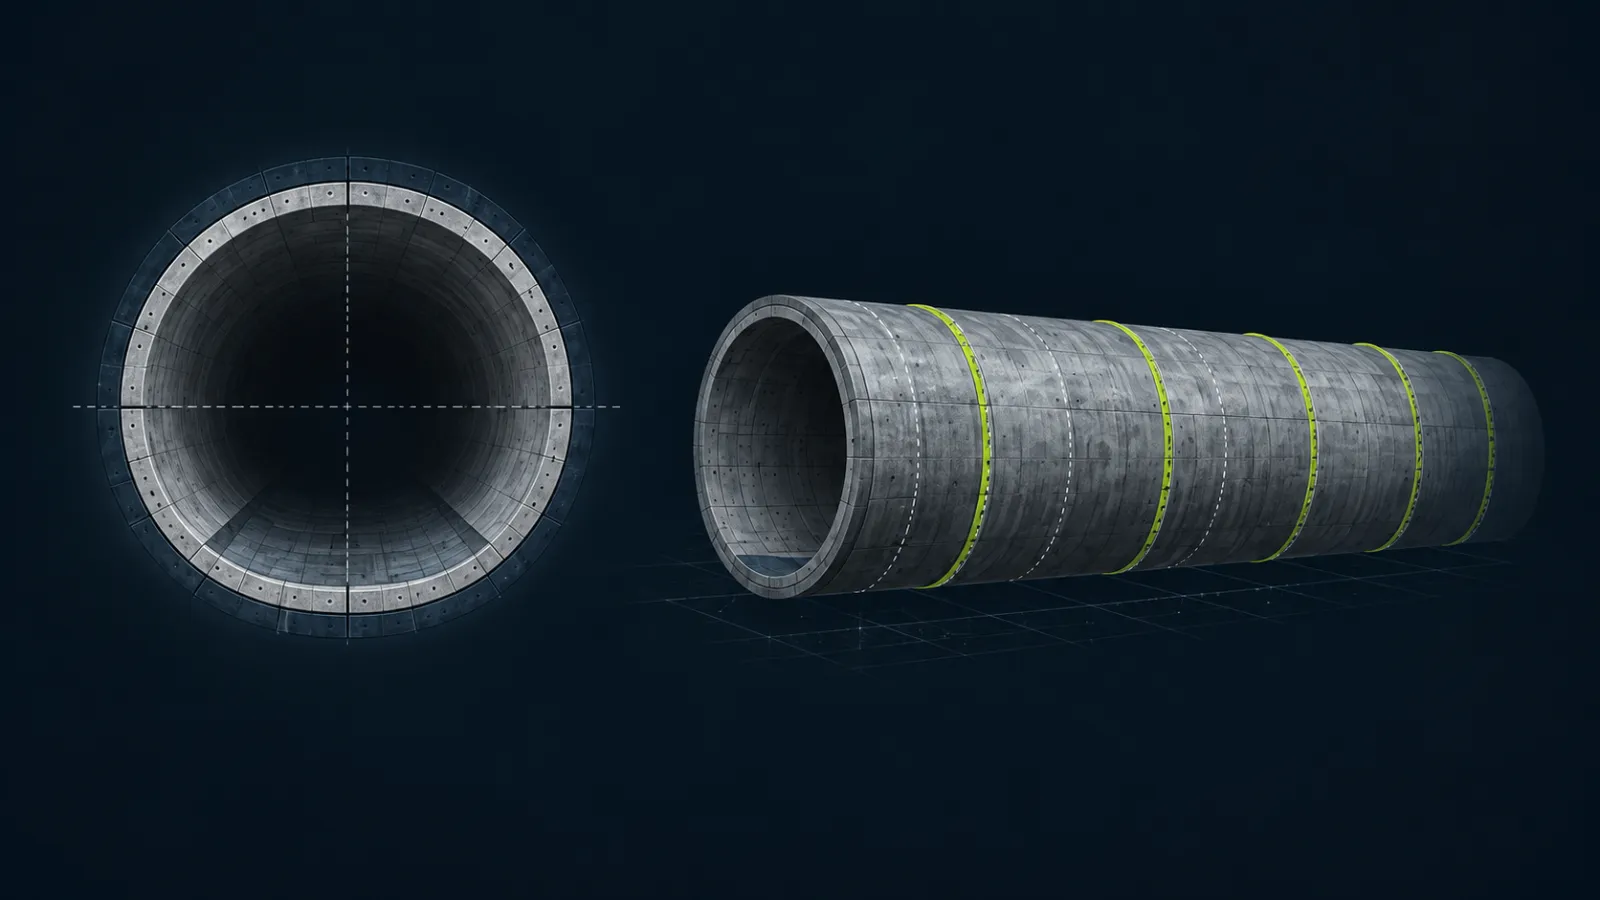
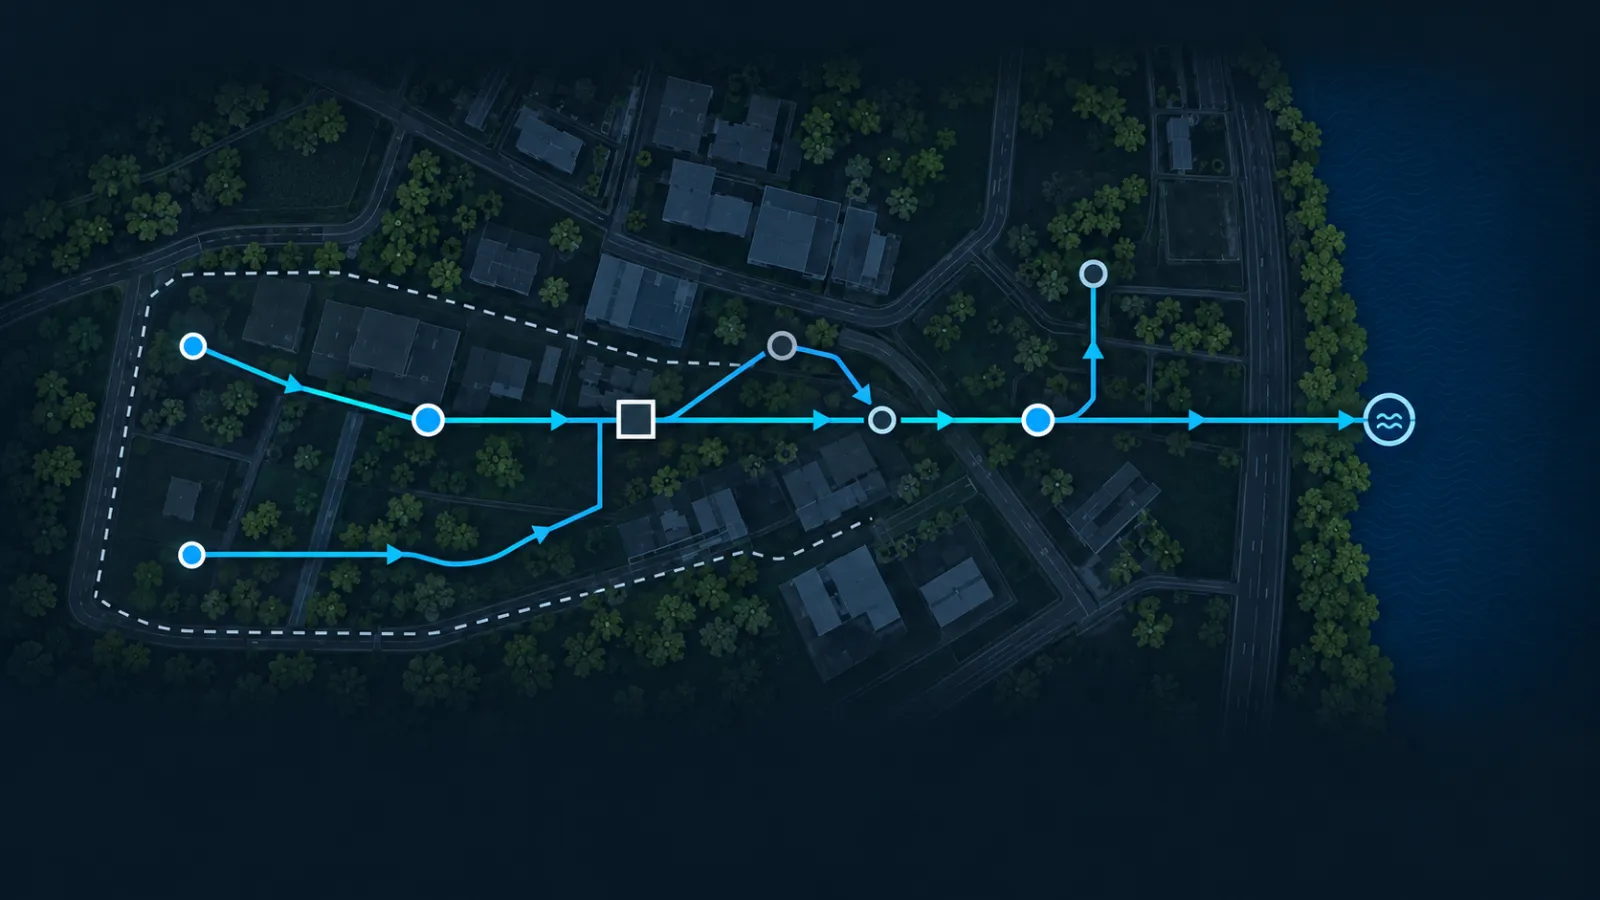
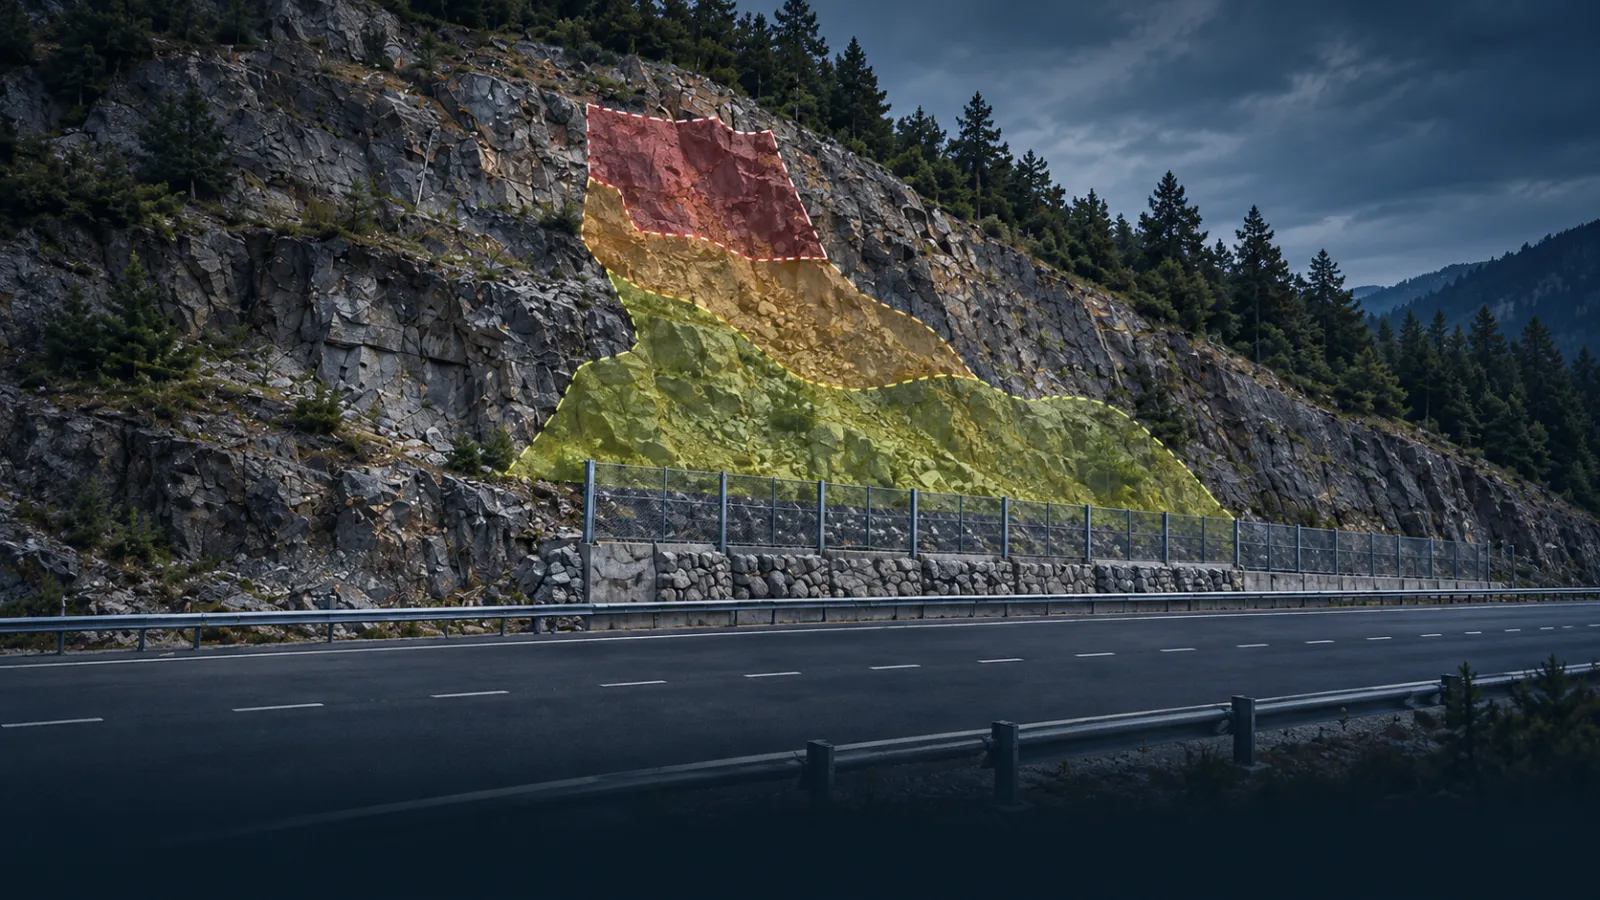
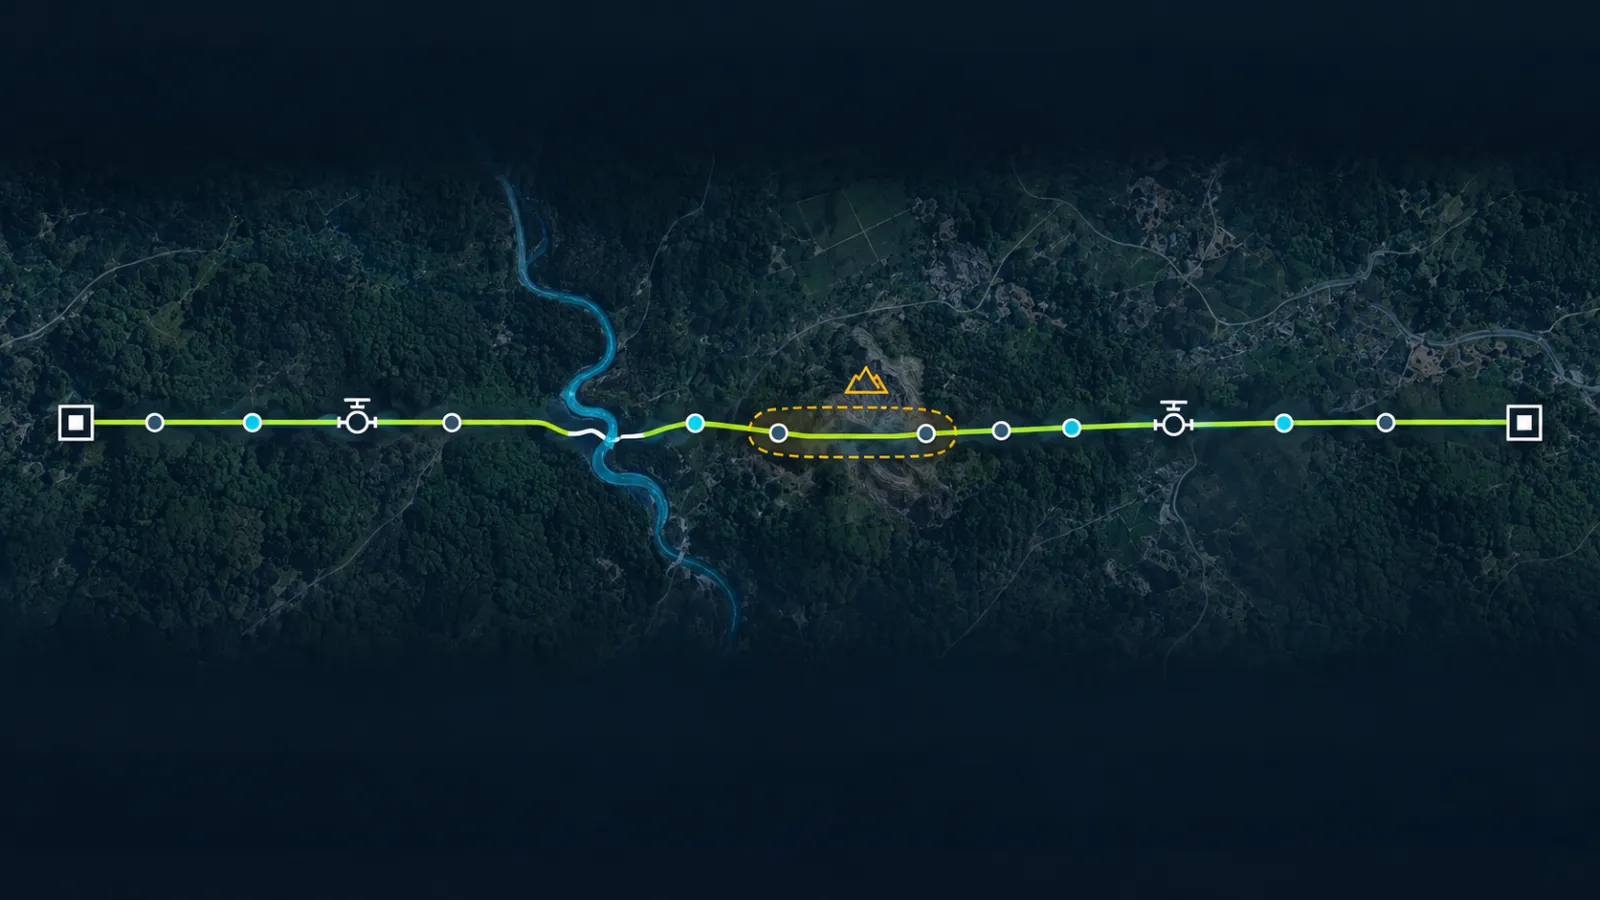
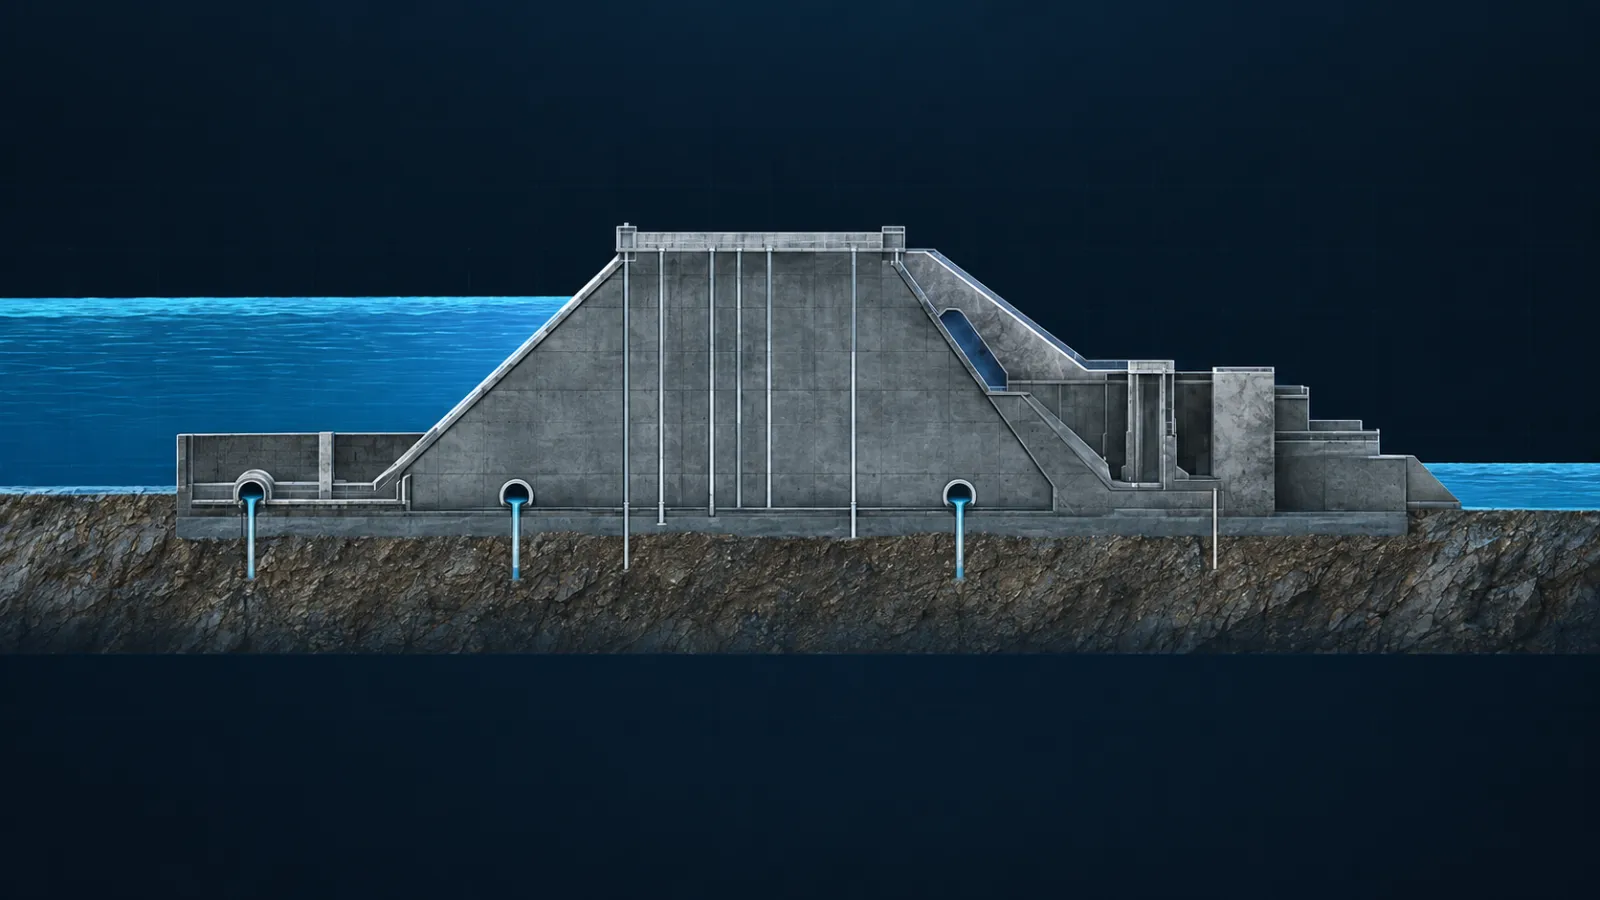
Clear states, early warning
Every sensor has Watch and Alert limits. When a reading crosses one, its pin, tile and trend change colour and an event is logged, so the team sees it before it becomes a problem.
Trends
Each reading with its moving mean and ±1σ band, over the window you choose.
Alerts
Watch and Alert limits per sensor, with an event log the team can review.
Reports
Monitoring reports in PDF and Excel from reviewed readings.
Site views
Camera views and crack inspection photos beside the sensors.
Planning monitoring for your site?
Share the structure, the works nearby and what you need to watch. Nattest Geo plans the instruments, installs them and sets up StructPulse.